Polygon: The Geospatial Engine Your Browser Deserves
How It Works?
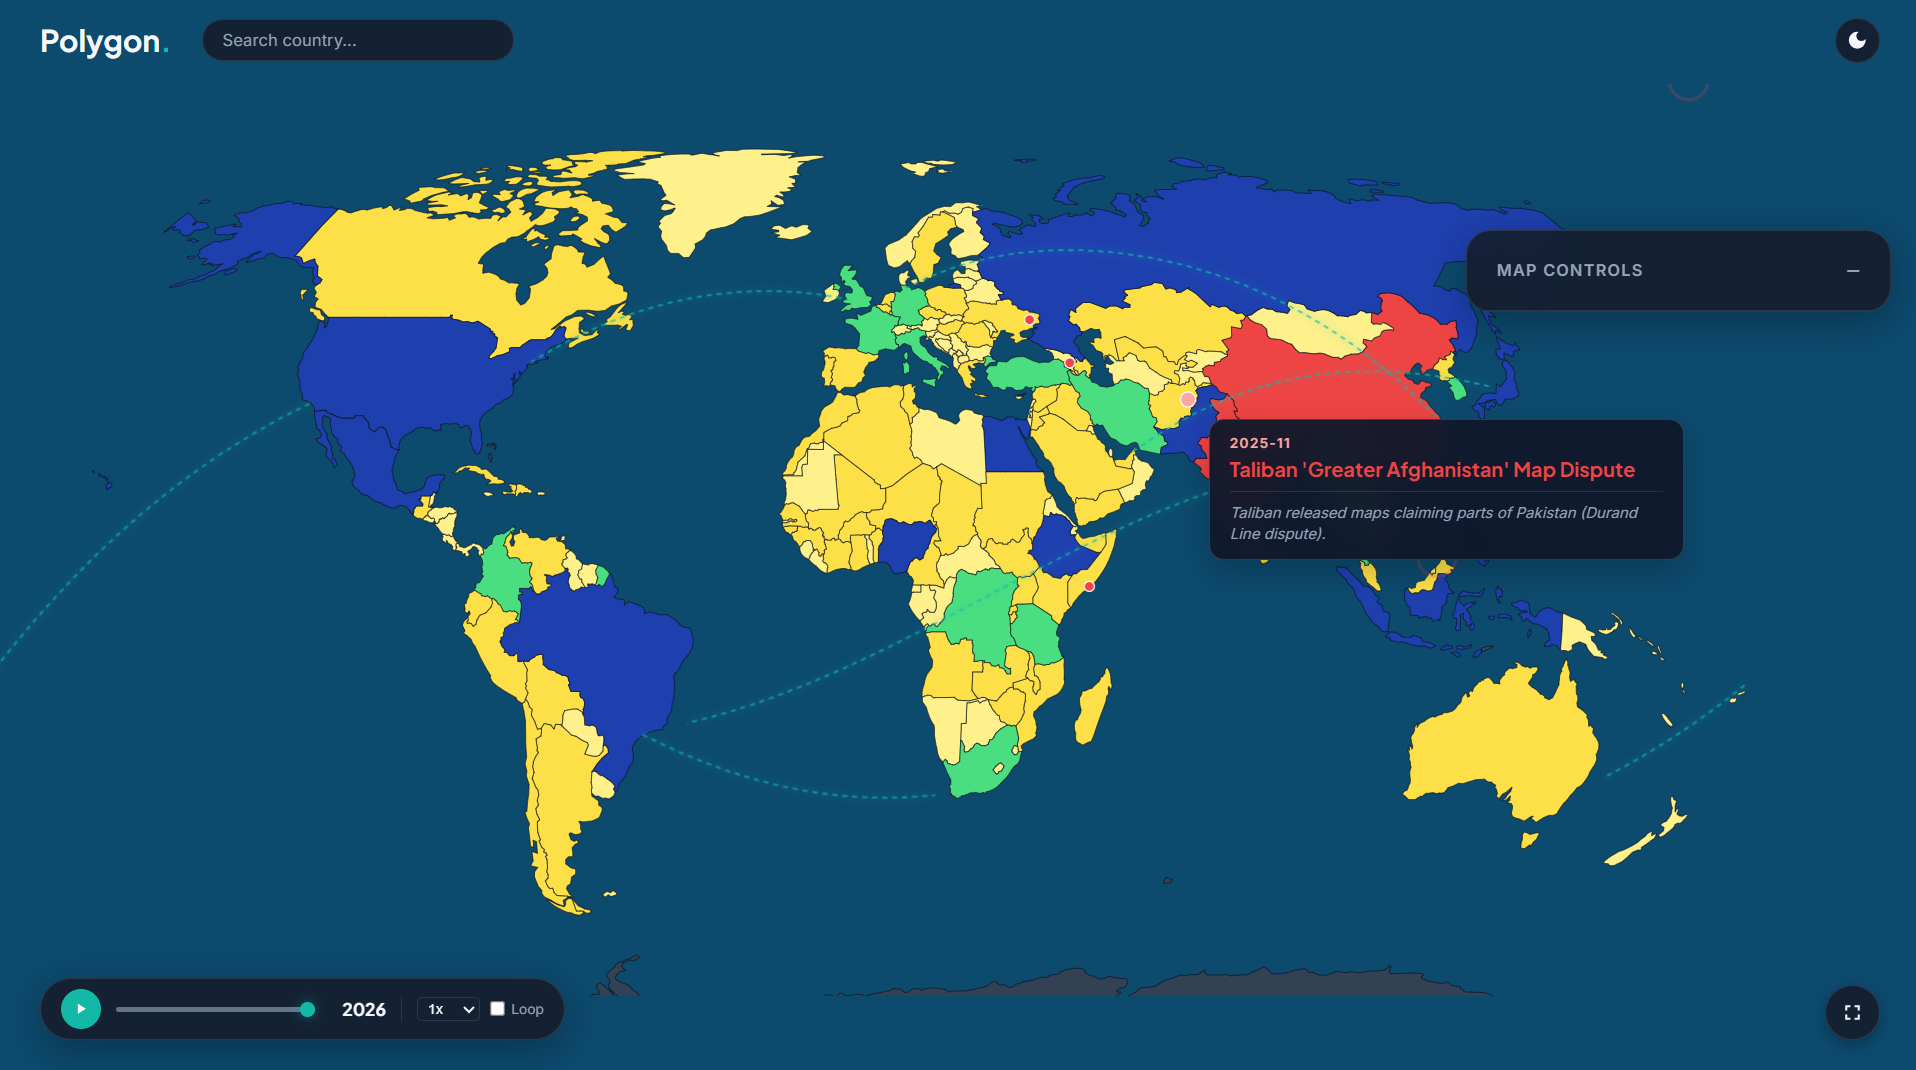
We cooked this entire beast up from scratch using GeoJSON data and D3, meaning your browser calculates the map borders on the fly in real-time instead of choking on a massive static file. It's packing a fully rotatable 3D globe, a time machine slider from 1980 to 2026, and instant drip-downs into any country's provinces.
Why You Need It
Ain't nobody got time to stare at a crusty spreadsheet to get the tea on global stats, and nobody wants a laggy website that freezes their PC. Polygon solves that by turning raw data into a sick, smooth dashboard that looks fire and runs smooth as butter.
How It Helps
Hover over any country to instantly catch the vibe on its population sparkline, languages, civilization history, and religion stats. Turn on Compare Mode to flex your country's stats against up to five others in a live bar chart, or just pull real-time population data with one click.
Why Share It
Drop this link in the group chat, spin the globe, and ask the squad, "Who do you think had the biggest population glow-up since 1980?" Watch the debate go crazy as you compare stats side-by-side. It's the ultimate interactive flex that actually teaches you something.
Tech stack
- Codex (GPT-6 Sol)
Links
Prompt
The visual style must be a modern glassmorphism design, meaning translucent panels with blur effects. Use a deep blue ocean background with countries colored by population, ranging from pale yellow to dark red. Implement a dark mode and light mode that change all colors smoothly. When in 3D globe mode, the background should become an animated space gradient. Countries should glow with a drop shadow and get a thicker border when hovered.

Layout
The map takes up the entire screen. A control panel floats on the right side and can be dragged anywhere by its header. A time slider sits in the bottom left corner next to a play button and speed controls. A fullscreen button floats in the bottom right. A comparison chart panel slides up from the bottom center when activated.

Input
A search bar at the top accepts typed country names and shows a dropdown of matching results with autocomplete. Clicking a country selects it or drills down into its provinces. Dragging the map rotates the 3D globe. Users interact with switches, sliders, and dropdown menus to control all visual layers and the timeline.

Sound
Add a subtle click sound when a user selects a country or toggles a setting to provide tactile feedback.

Features
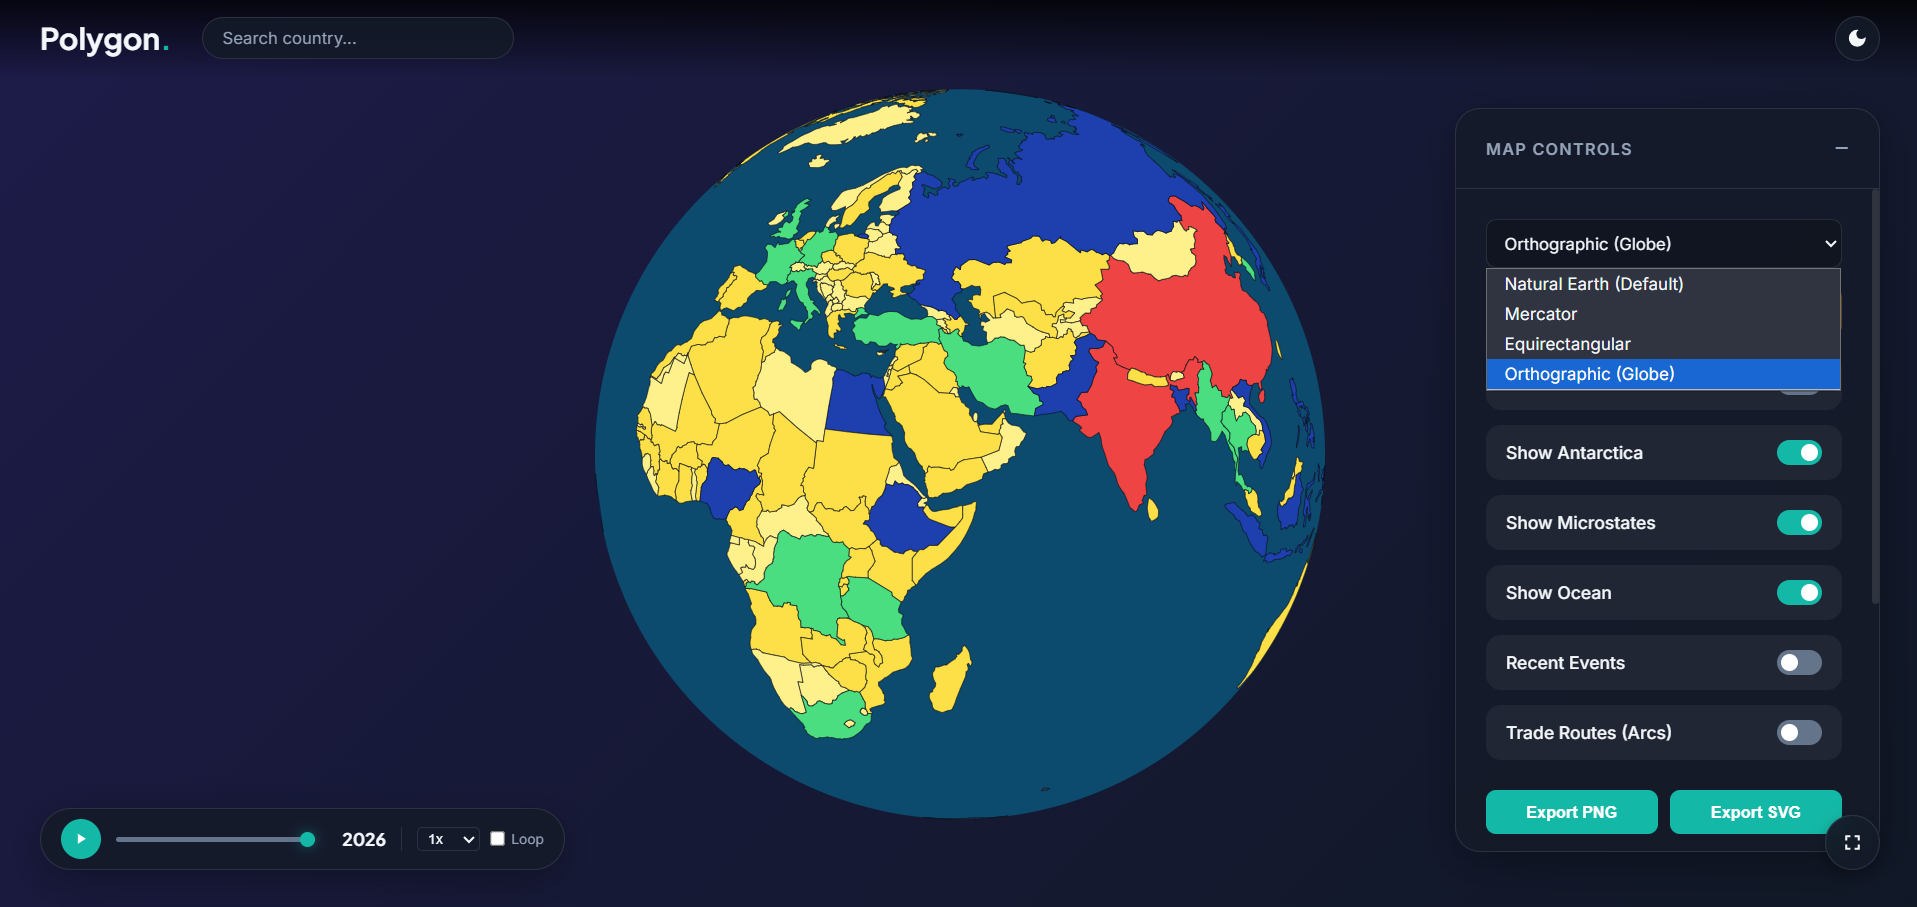
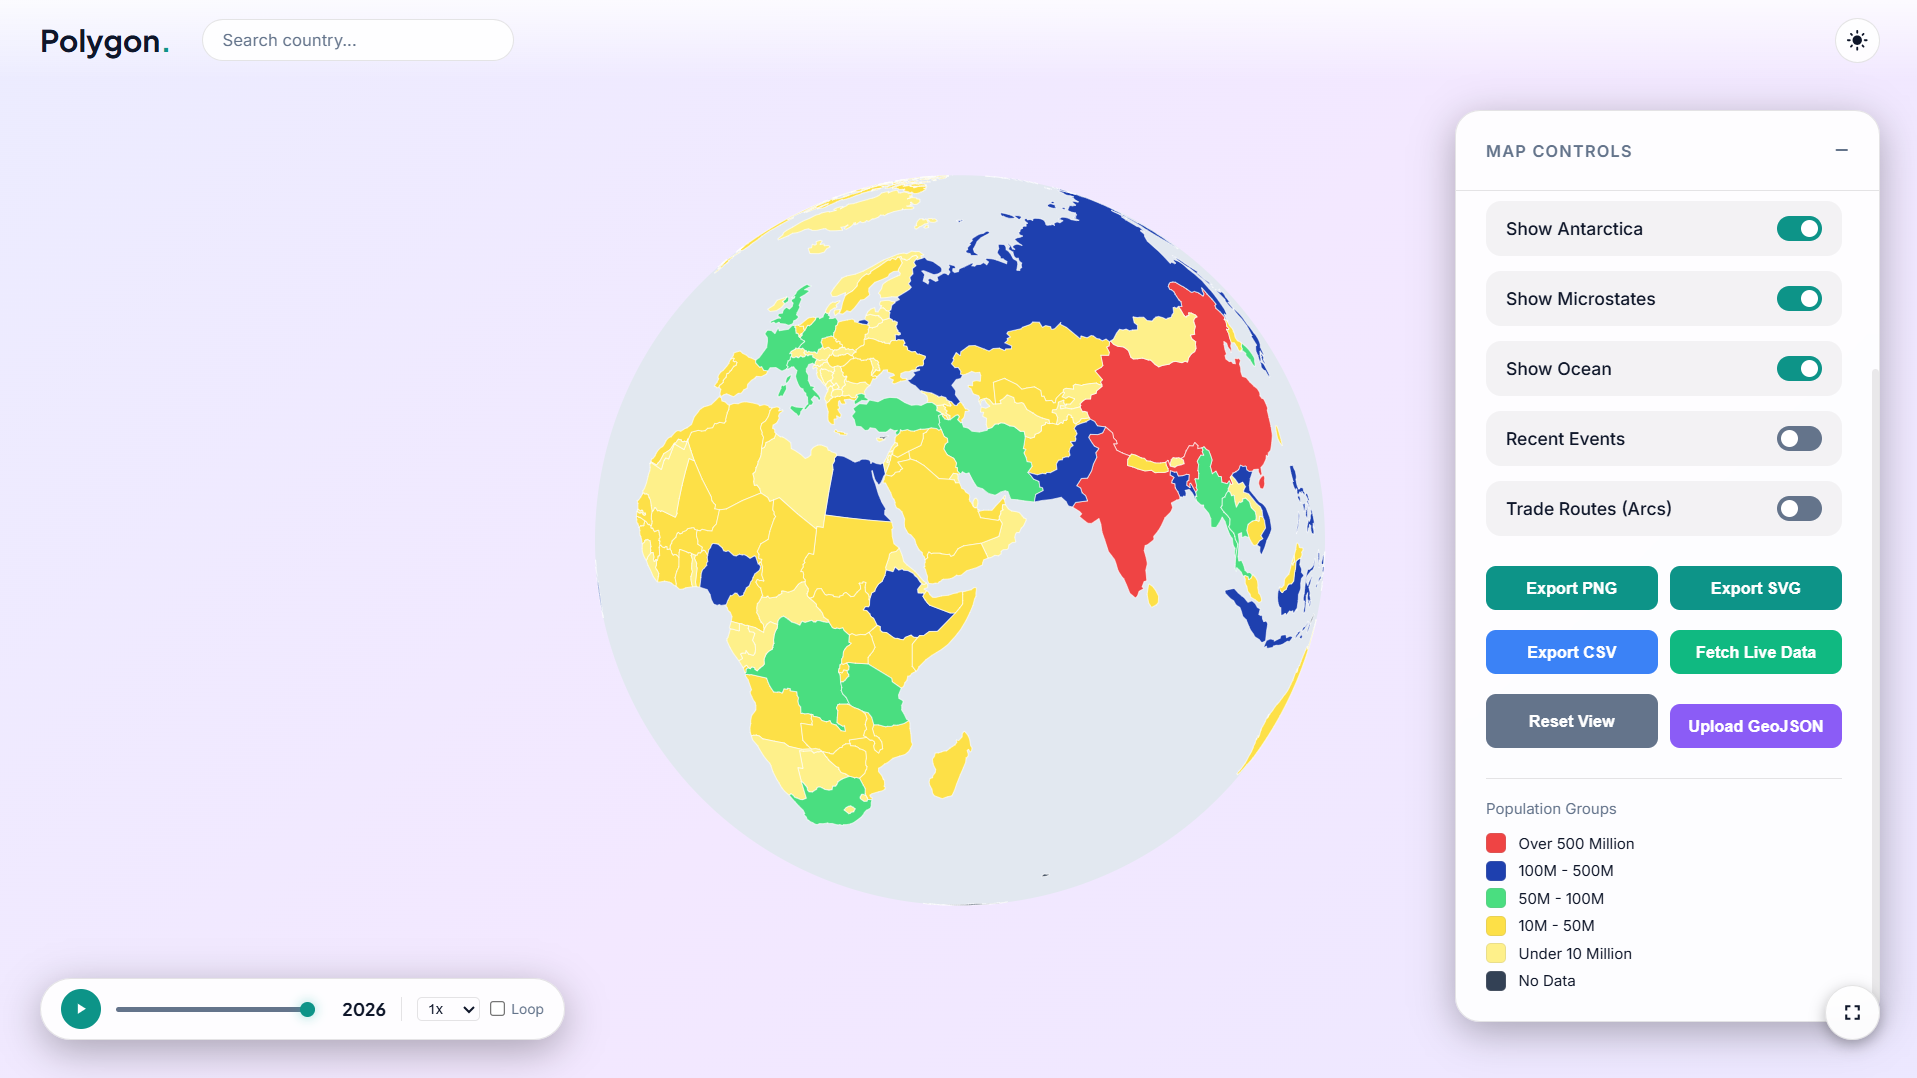
The engine must support switching between flat map projections (Natural Earth, Mercator) and a 3D rotatable globe. A timeline slider animates population growth from 1980 to 2026. Hovering over a country shows a tooltip with a population mini line chart, languages, civilization history, and top religions (Islam in green, Christianity in blue, others in white). Clicking a country dynamically loads its states or provinces. A compare mode allows selecting up to five countries to show a live bar chart comparison. Users can fetch live population data, export the map as PNG or SVG, download data as CSV, and upload custom GeoJSON files. Animated dashed lines show trade routes, and pulsing red dots show recent geopolitical events.

Settings
Provide toggles for showing map labels, Antarctica, microstates, the ocean layer, recent events, and trade routes. Allow changing the map projection and switching between dark and light themes.

Final Notes
Keep the code modular and easy to read. Test everything in a browser to ensure there are no console errors. Make sure any audio starts only after the first user gesture.3 likes · 2 comments · 1 view
Comments (2)
nice build anselm.
great idea and smooth website, amazing build.
Love this bro. Such a neat idea and the site looks great